Health warning over bloom tainted Waikato lakes
"The Waikato District Health Board is warning people away from several lakes because of toxic and harmful cyanobacterial blooms."
4 November 2011
New Zealand Herald
Lake Rotoiti health warning lifted
"Health warnings have been lifted at Lake Rotoiti, except for Okawa Bay, and at Lake Okaro"
10 May 2005
New Zealand Herald
Water quality overtakes air pollution as big worry
"New Zealanders are now so worried about the quality of rivers, streams and lakes, that
water quality has overtaken air pollution as the nation's leading environmental worry,
researchers say."
20 April 2005
New Zealand Herald
Water fails clean, green test
"Almost all of New Zealand's lowland streams and rivers are unsafe to swim in ..."
16 July 2004
New Zealand Herald
Diversion may save Lake Rotoiti
"Diverting Lake Rotorua's outflow directly into the Kaituna River may be the saving of
neighbouring Lake Rotoiti ..."
8 December 2004
New Zealand Herald
|
|
|
 |
| |
How clean and green is New Zealand? Freshwater ecosystems are at risk |
| |
23 March 2005
New Zealand has successfully established its "Clean and Green" brand in marketing tourism
and food products to the world. The "100% Pure New Zealand" slogan is also used to
attract tourism.
Just how clean and green is New Zealand under the surface of its green grassy pasture, lush evergreen forest and sparkling water image?
Not quite so clean, according to a government commissioned study by the National Institute of Water and Atmospheric Research entitled "Water quality in low-elevation streams and rivers: recent state and trends in contrasting land-cover classes".
Dr Dell Hood, Waikato Medical Officer of Health, said the study shows that children should
not swim in most of the country's lowland rivers. |
| |
| |
Comparison of water quality in low-elevation rivers, with guidelines and rivers in all
elevation zones |
|
DRP |
NOx |
NH4 |
TN |
TP |
clar. |
E.coli |
cond. |
Guideline value |
|
0.01 |
0.44 |
0.02 |
0.61 |
0.03 |
1.3 |
<126 |
175 |
Low-elevation |
Median |
0.016 |
0.55 |
0.029 |
1.03 |
0.06 |
1.4 |
664 |
68.6 |
Mean |
0.033 |
1.08 |
0.058 |
1.71 |
0.07 |
1.7 |
906 |
113.6 |
SD |
0.065 |
1.48 |
0.144 |
1.82 |
0.08 |
1.1 |
1033 |
124.6 |
N |
320 |
237 |
322 |
158 |
254 |
281 |
229 |
188 |
National River Water Quality Network |
Median |
0.006 |
0.15 |
0.007 |
0.33 |
0.03 |
1.7 |
|
118.6 |
Mean |
0.011 |
0.26 |
0.011 |
0.41 |
0.04 |
2.3 |
NA |
142.4 |
SD |
0.014 |
0.33 |
0.013 |
0.39 |
0.04 |
1.8 |
|
93.7 |
| N |
77 |
77 |
77 |
75 |
76 |
77 |
|
77 |
DRP, dissolved reactive phosphorous; NOx, oxidised nitrogen;
NH4, ammonium; TN, total nitrogen; TP, total phosphorous;
clar., clarity in m; E.coli, Escherichia coli in number per 100 ml;
cond., conductivity; NA, no data avaiable
Data: "Water quality in low-elevation streams and rivers: Recent state and trends in
contrasting land-cover classes", Larned, Scarsbrook, Snelder, Norton, Biggs, 2004. |
| |
The article, published in 2004 in the New Zealand Journal of Marine and Freshwater Research, a publication of the Royal Society of New Zealand, is a very unfavourable report on the water quality of 229 lowland waterways.
Guideline water quality values for protection of New Zealand river ecosystems and human health are recommended in the Australian and New Zealand Guidelines for Fresh and Marine Water Quality (Australian New Zealand ECC), and jointly by the Ministry for the Environment, and Department of Health.
The median dissolved reactive phosphorus, oxidised nitrogen, ammonium, and E. coli concentrations in streams in pastoral and urban classifications of the study exceeded guidelines, and clarity did not meet the guideline. |
| |
 |
| |
"... New Zealand aspires to be seen internationally as being clean and green, and a responsible steward of its environment and biodiversity ..."
The New Zealand Biodiversity Strategy 2000 |
| |
|
| |
| The median E. coli concentration in native forest streams, and conductivity in plantation forest streams exceeded guidelines.
The E. coli guideline was exceeded at every urban location, and dissolved reactive phosphorus, oxidised nitrogen, and ammonium guidelines were exceeded at 92, 86 and 83 percent of the sites respectively.
E. coli, dissolved reactive phosphorus, oxidised nitrogen, and ammonium guidelines were exceeded at 96, 88, 64 and 78 percent of the pastoral locations respectively. |
| |
|
| |
|
 |
| |
|
|
| |
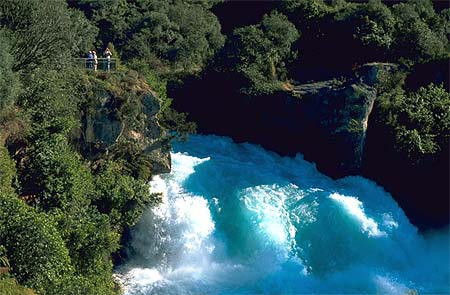
Above: Huka Falls, just north and down-stream from Lake Taupo on the Waikato River, is a spectacular display of the force of water, with up to 220,000 liters per second passing through the narrow river channel.
Photo Permission and Copyright © Virtual New Zealand |
| |
 |
| |
Similar contamination levels in urban and pastoral streams .....
The national median concentrations of phosphorus, oxidised nitrogen, E. coli, and ammonium of low-elevation streams in all classes of land cover (urban, pastoral, native forest, and plantation forest) combined, exceeded guidelines. Guidelines for clarity and conductivity were met however.
Almost all lowland waterways in the North Island, including the Waipa, Waihau, Whanganui, and Manawatu Rivers are failing to meet health guidelines. |
| |
|
| |
"... New Zealand's land-based primary production - farming, forestry and horticulture - is reliant on the protection and management of biological systems ..."
The New Zealand Biodiversity Strategy 2000 |
| |
|
| |
The Waikato River, the largest, is an exception in its upper section, but high pollution levels occur below the confluence where dirty Waipa River water joins it at Ngaruawahia.
The 2004 NIWA study compared urban and pastoral waterways for the first time in New Zealand, with surprising results. The similarities found in water quality of urban and pastoral classifactions were unexpected.
A report released by the Hauraki Gulf Forum on March 22nd 2005, states that the Tamaki Estuary is one of the Auckland region's most polluted bodies of water, and that many rivers and streams flowing into the gulf are in poor condition. Swimming near built-up areas is not safe after heavy rain according to the report. |
| |
|
Pollution from intensive farming .....
A predominant cause of New Zealand water pollution is intensive farming, or what is referred to as "dirty dairying".
The terrible condition of Waikato lakes was strikingly demonstrated by the death of ten cattle, that drank algae contaminated water from Lake Rotongaro near Huntly.
This lake is one of six, together with the Hakanoa, Kainui, Ngaroto, Waahi and Whangape Lakes, that are the subject of health warnings.
The Waikato lakes have received less attention than the Rotorua, Rotoiti and Rotoma Lakes in the Rotorua area which the government has committed to clean up.
Environment Waikato water sampling revealed the algal toxin Microcystin and the blue-green algae Microcystis in Lake Rotongaro.
Algae levels were 40 times higher, and toxin levels were 760 times higher than water quality standards for stock.
Nutrients get into into rural waterways from fertilizer, and animal fecal waste runoff.
There are no longer natural filtering systems, such as forested areas and wetlands to take up the potassium, nitrogen and ammonium.
During the last 50 years, many farmers have cleared gullies and drained wetlands to squeeze more production from additional grazing area.
Higher production has also been sought from over-stocking and high levels of fertilization.
Many farms have been stripped of all vegetation other than edible grass - even hedges, the havens of mini-ecosystems, have been replaced by post and wire fencing.
While some farmers have seen the benefit of fencing off waterways and gullies to keep stock out, and are planting trees and letting plants regenerate naturally, there is a long, long way to go to provide filtering systems for runoff throughout all catchments.
|
|
|